Shuffle practice
2026-01-05
I'm not good at shuffling a deck of playing cards, and wanted to practice the riffle shuffle. There's a result that it takes 7 riffles to randomize a deck (wikipedia, youtube). To see the full effect of a shuffle, we need to know the order of cards in a deck before and after. I have some tools to annotate a deck and inspect shuffles in the shuffle_practice repo. The repo has example data which I will refer to in this post.
Deck image
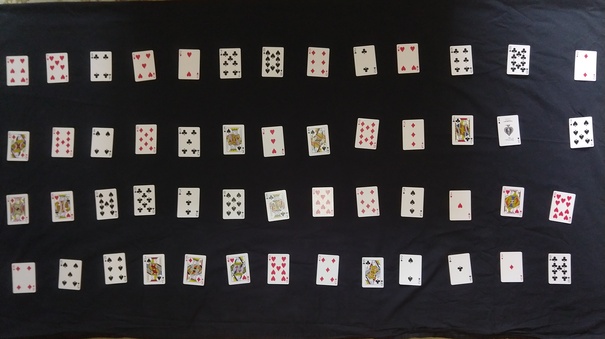
I started with capturing an image of all 52 cards in a deck. I laid them out on the floor against a dark background to make further image processing tasks easier.
These are some conventions I used for ordering a deck.
- With cards stacked face-down, the bottom-most card is the first, and the top-most card is the last.
- In a deck image, the order of cards is left-right, top-down. The first card is the top-left, and last card is bottom-right.
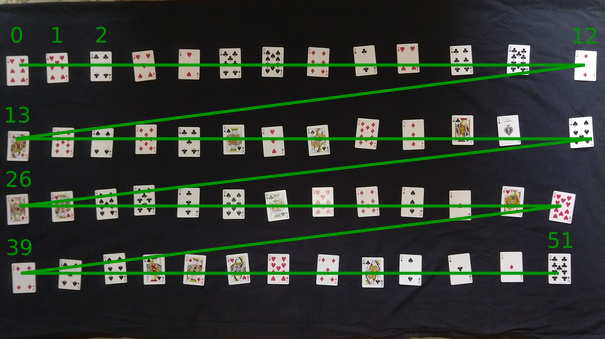
I only performed riffles, and captured a deck image after every single riffle. In the example sequence included with the repo, there are 8 images of decks, for a total of 7 riffles between the first and last deck. The image above is of the first deck, before any shuffles.
Segmentation
The next task was to segment a deck image into individual cards. I used segment-anything for this purpose. I worked on a cpu-only machine, so I used the smallest model along with a scaled-down image. The model segmented cards very well, but could also generate spurious segments.
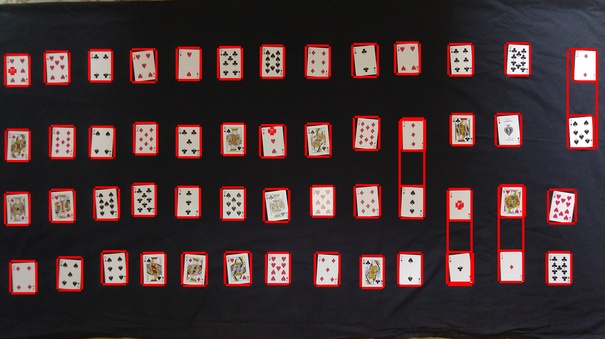
I got rid of unwanted segments with some simple filtering (such as expected card area and aspect ratio). This worked because I used a fixed set of playing cards, and tried to capture consistent deck images. I often captured a couple of images of the same deck, and chose one on which segmentation worked.
Classification
Once I had card segments, I used
open_clip for labeling the cards.
Based on some
evaluation
(see the final deck accuracy column in the linked csv), the (SigLIP, webli)
models stood out as having very good performance, without any prompt
engineering. Perhaps the webli dataset includes playing cards, but I didn't
confirm.
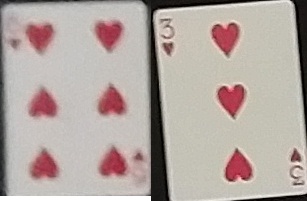
Predictions were correct for cards that were clearly visible, such as the 3h
card
shown below. I took deck images on a phone, and cards near the edges were
consistently blurry. The SigLIP model I used often did well labeling even
these, such as the 6h
card.
I used the classification output as a seed to manually annotate the decks. Classification was pretty good (average accuracy 97% on the 8 example images) which simplified this step.
Permutation stats
With the annotation files in place, I could get an informal picture of shuffle quality. My example sequence of shuffles was far from perfect.
I found looking at permutation matrices to be helpful. A permutation matrix is
a matrix of zeros and ones that maps a source sequence to a permutation. In all
the matrices shown, the source was the starting deck (20251008_01). The three
images below are the permutation matrix after 1, 2, and 3 riffles. In other
words, they map deck 1 to 2, 3, and 4.
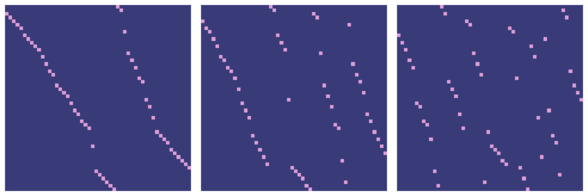
- After 1 riffle, the matrix has 2 clear diagonals, corresponding to the cards in the left and right hand. It shows that I tended to drop groups of 3-4 cards at once.
- After 2 riffles, the matrix interestingly has 4 diagonals.
- After 3 riffles, the pattern of doubling diagonals is less convincing.
Shuffle 6, between decks 6 and 7, was so bad that it isn't even a riffle. I tried to follow the riffle with a bridge, but fumbled, and undid most of the riffle. Perhaps my sequence of 7 riffles is effectively only 6.

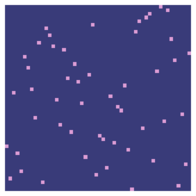
The overall permutation matrix, between decks 1 and 8, looks pretty scattered, although a diagonal bias possibly still remains.
In a permuted sequence, a pair of elements is inverted if their order is
flipped, relative to the source sequence. For a deck of 52 cards, the expected
number of inversions for a uniform random permutation is 52 * 51 / 4 = 663.
The number of inversions in my sequence of shuffles (relative to the starting
deck) is below.
281, 452, 583, 618, 696, 740, 714
I don't have anything as principled as confidence intervals, but 714 seems
far enough from 663 to suggest that my riffle shuffle needed more practice.
Conclusion
At the start of the project, I thought I would learn about random permutation statistics. Instead, I spent time working with zero-shot models for segmentation and classification, which to their credit worked very well.
The limiting factor for more statistics was data collection effort. In the final state of my code and workflow, it took me more than a couple of hours to capture, annotate, and inspect a sequence of 7 riffles, or 8 decks. I didn't have enough data instances to look into questions like the following.
- A hypothesis test for uniform random shuffles, including a consideration of alternatives and error rates. The wikipedia page on Random permutation statistics is a starting point.
- Correlation statistics between successive shuffles, which are not independent samples from a distribution.
- Exploring whether 6 riffles is enough, another result mentioned on the wikipedia entry on riffle shuffles.
I concluded this project once it became more fun, and practice, to shuffle in service of an actual game of cards.